Mapping Nucleic Acids in Tissue Sections
2D PCR is a method for mapping the locations of target nucleic acid sequences (DNA, RNA) in tissue sections. The concept is illustrated below. A tissue section is transferred onto a multi-well array. The DNA or RNA is extracted from the tissue and amplified under clean conditions within the wells by PCR. The locations of the PCR products, and for RNA also the amounts, are detected within the wells. This method allows mapping of genes and gene expression because it maintains the original relative spatial locations of the nucleic acids, allowing that information to be correlated with the histology.
2D PCR concept. DNA
Figure is from M. Armani, J. Rodriguez-Canales, J. Gillespie, J. Tangrea, H. Erickson, M. R. Emmert-Buck, B. Shapiro, and E. Smela, "2D-PCR: a method of mapping DNA in tissue sections," Lab Chip, 9, 3526-3534 (2009).
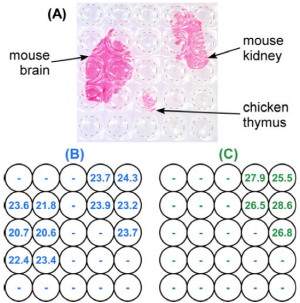
RNA Levels of mRNA vary across tissue and in disease. Quantifying low-abundance mRNA requires amplification using the quantitative polymerase chain reaction (RT-qPCR) after performing a reverse-transcription. This is complex because these steps are typically performed in three separate platforms. We have developed a two-dimensional method of RT-qPCR (2D-RT-qPCR)that quantifies RNA across tissues sections in a single integrated platform. A multi-well plate macrodissects the tissue and preserves the spatial locations of the RNA. A lysis and nucleic acid purification protocol is performed in the same multi-well plate, followed by RT-qPCR. The results of a multiplexed reaction are shown in the figure, demonstrating that a "housekeeping" mouse RNA are seen in both mouse tissues but not the chicken tissue, and a kidney RNA only in the kidney section.
2D-RT-qPCR result. A Photograph of three tissue sections: mouse brain, mouse kidney, and chicken thymus on an adhesive film (stained red for visualization) transferred onto a 384-well plate (visible under the tissue, with well positions are indicated by circular outlines.) B HPRT1 and C KCNJ1 quantitative cycles of detection thresholds (Cts) determined by RT-qPCR at the well locations indicated in (A). HPRT1 is specific for mouse tissue, and KCNJ1 for kidney tissue. Figure is from M. Armani, M. A. Tangrea, B. Shapiro, M. R. Emmert-Buck, and E. Smela, "Quantifying mRNA levels across tissue sections with 2D-RT-qPCR," Anal. Bioanal. Chem., 400 (10), 3383-3393 (2011).
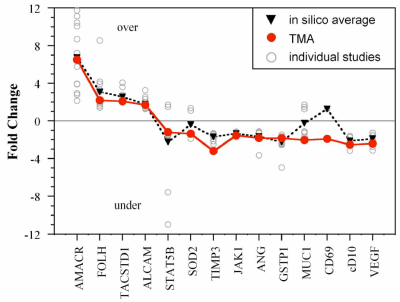
We have introduced a method for performing quantitative gene expression analysis across a tissue microarray (TMA) using an adaptation of 2D-RT-qPCR. A TMA with tumor and normal human prostate samples was used to validate expression profiles from previous array-based gene discovery studies of prostate cancer. 2D-RT-qPCR thus expands the utility of TMAs to include sensitive and accurate gene expression measurements. This is useful in the development of biomarkers.
Fold change of mRNA levels in our TMA study (red circles) compared with the average of 14 Oncomine 3.0 gene expression datasets (black triangles). Values from each gene expression study are also plotted separately (gray unfilled circles). Numbers > 0 indicate overexpression of the gene in the cancer tissues, and those < 0, underexpression. Figure is from: M. Armani, M. Tangrea, B. Yang, A. Rosenberg, K. Ylaya, J. Martinez, J. Rodriguez-Canales, J. Hanson, B. Shapiro, M. R. Emmert-Buck, E. Smela, and S. M. Hewitt, "Multiplex quantitative measurement of mRNAs from fixed tissue microarray sections," Diag. Molec. Pathol., 22 (5), 323-330 (2014).
M. Armani, J. Rodriguez-Canales, J. Gillespie, J. Tangrea, H. Erickson, M. R. Emmert-Buck, B. Shapiro, and E. Smela, "2D-PCR: a method of mapping DNA in tissue sections," Lab Chip, 9, 3526-3534 (2009) M. Armani, M. A. Tangrea, B. Shapiro, M. R. Emmert-Buck, and E. Smela, "Quantifying mRNA levels across tissue sections with 2D-RT-qPCR," Anal. Bioanal. Chem., 400 (10), 3383-3393 (2011). M. Armani, M. Tangrea, B. Yang, A. Rosenberg, K. Ylaya, J. Martinez, J. Rodriguez-Canales, J. Hanson, B. Shapiro, M. R. Emmert-Buck, E. Smela, and S. M. Hewitt, "Multiplex quantitative measurement of mRNAs from fixed tissue microarray sections," Diag. Molec. Pathol., 22 (5), 323-330 (2014).
|
|
|
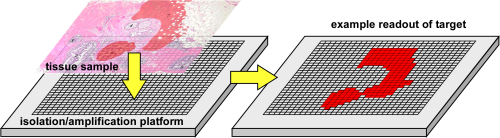
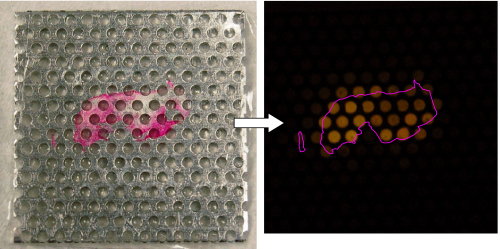 Image of a breast tissue section (stained pink for visualization with Eosin Y)
after transfer onto the multi-well device, and the visualization map created by fluorescent DNA detection
with SYBR Green I after amplification by 2D-PCR. The tissue position is indicated by the pink outline.
Image of a breast tissue section (stained pink for visualization with Eosin Y)
after transfer onto the multi-well device, and the visualization map created by fluorescent DNA detection
with SYBR Green I after amplification by 2D-PCR. The tissue position is indicated by the pink outline.
©2013