Conjugated Polymer Actuators
Understanding Ion Transport Device for Visualizing Inplane Ion Transport | Measurements of Inplane Ion Transport Modeling | References for Further Information Device for Visualizing Inplane Ion Transport
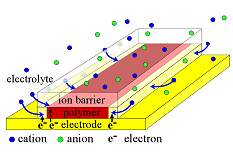
The device on the left was devised in order to ensure that this is the case: above a thin film of PPy, there is a transparent polymeric ion barrier that prevents ions from entering the PPy from the top, and forces them to enter from the sides. This figure is not to scale: the polymer is 300 nm thick and 300 µm wide. The paths for the electronic charges (whether we call them electrons, polarons, bipolarons, or holes) to fill the polymer are thus short (max 0.3 µm) compared to the long path (max 150 µm) that the ions need to take. Measurements of Inplane Ion Transport
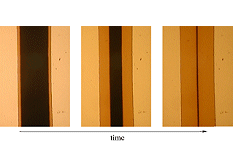
By analyzing these videos, we can draw several conclusions. First, between -0.8 and -1.6 V vs. Ag/AgCl, the ion velocity increases linearly with the voltage. (At more negative voltages, the velocity tops out at ~70 µm/sec.) Among other pieces of evidence, this shows that ion transport is primarily by migration (charge transport under an electric field), not diffusion (transport down a concentration gradient due to random motion). Second, the velocity slows down as the front enters the film. Third, the velocity increases if the polymer is partially reduced and so the matrix is more open to start with (under -1.1 V, the velocity goes from ~20 µm/sec if the polymer starts at 0 V up to ~200 µm/sec if it starts at -0.6 V) The volume change occurs together with the color change. One can see an increase in the height of the film (for example by mechanical profilometry, and also visually because of the step) that corresponds with the color change, moving from the edges to the center at the same rate. Both the volume and color reach maximum values that do not depend on the applied potential beyond -1.0 V vs. Ag/AgCl (the potential at which PPy is fully reduced in aqueous electrolytes). This is expected, since the film is fully reduced, and increasing the voltage does not change the oxidation level further. Upon oxidation, there is no front – the film gets darker everywhere at once, although more rapidly at the edges. In this direction, modeling shows that there are no voltage drops across the polymer, so that transport is by diffusion. The oxidation reaction cannot be speeded up by increasing the positive voltage. We have developed a model that accounts for the movement, in the polymer and in the electrolyte, of both ionic charge and electronic charge through two means: diffusion and drift. The model comprises three coupled partial differential equations (PDEs). It has no adjustable parameters – this is not curve fitting. When the geometry studied above is simulated, it accounts well for all of the all the experimental observations, except for the rate of front broadening. The model shows that during reduction, ion transport is due primarily to migration; diffusion makes a significant contribution to the behavior only when V is small. (The experimental results cannot be accounted for with only diffusion.) The front velocity slows down as There is a significant voltage drop across the electrolyte, and depletion and double-layers form at the polymer/electrolyte interface. If the ion concentration in the electrolyte is low, then ion transport in the electrolyte becomes the rate limiting step, and the front in the polymer again propagates linearly with time. The front velocity increases with electrolyte concentration up to a point, then approaches a constant value. In films uncovered by an ion barrier, the inplane mobility must be about 10,000 faster than the out of plane mobility in order to see, as we do experimentally, fronts moving parallel to the surface of the film. For thin films, transport within the polymer is primarily by diffusion. During oxidation, there is negligible voltage drop across the film, so transport is primarily by diffusion. In ion-barrier covered films, increasing the voltage does not increase the ion transport rate. Ironically, in thin films without a barrier, the oxidation speed depends strongly on voltage. References for Further Information
|
|
|
©2013
 In order to study ion transport, it must be the rate-limiting step in the electrochemical reaction (as opposed to ion transport through the electrolyte to the polymer/electrolyte surface, polymer chain conformational changes, electron transport in the polymer, electron transfer to/from the electrode, or the reaction taking place at the counter electrode).
  The figure illustrates a film that has been partially reduced. The reduction reaction cannot take place until the ions responsible for maintaining charge neutrality arrive. This device makes use of the electrochromism of polymer: one can see where the ions have reached by the color, which is dark red for 0.3 µm thick oxidized PPy(DBS) on Au, and transparent (thus looks yellow because of the underlying Au) when the film is reduced. The color change thus occurs at the front of the cation “wave” entering from the edges. In as-deposited films, the polymer matrix is tightly packed (almost no free volume), so during the first-ever reduction, this wave moves slowly as is very sharp, as shown here.